Azure Data Explorer is a powerful tool for data engineers to cost-effectively process real-time data, such as IoT data. In this blog, I tell you what I learned about Azure Data Explorer in the past 4 months and how you can hit the ground running with it. Real-time data platforms are more in demand than ever, and Azure Data Explorer is the right solution for many cases!
Consider using serverless SQL
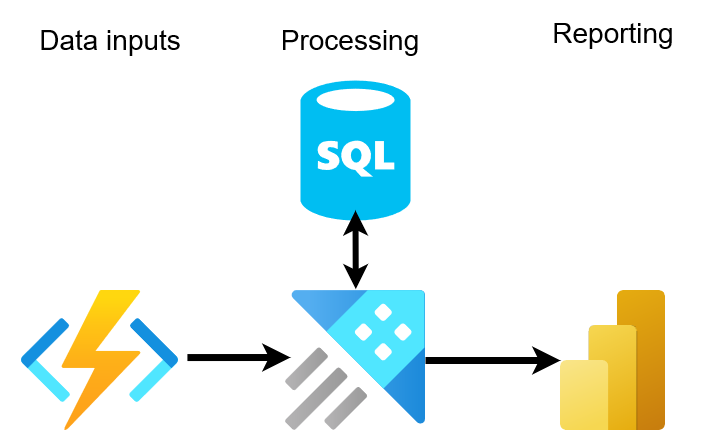
In August, I started using Azure Data Explorer (ADX) together with Power BI for IoT data. ADX is a good choice for cases where we want real-time performance for a good price and ease of use. ADX query language Kusto is relatively similar to SQL, and anyone familiar with SQL can use Kusto quite easily. So far, so good, but some things can cause headaches. While ADX excels in streaming data, it definitely is not the best as an operational database, as any change to data and schema changes are not possible. On the other hand, it’s possible to integrate SQL databases to act like a normal table in Kusto. For metadata bound for changes, I would suggest using serverless SQL. In a nutshell, ADX is a great data warehouse, but if you have operational database needs, then combining it with an operational database is a great idea. Serverless SQL is quite a cheap solution if you can keep the server down most of the time and make all updates during a short period.
The ADX architecture with SQL could be something like this:
Azure Data Explorer pricing is straightforward
Azure Data Explorer pricing is quite cheap compared to other solutions that can handle real-time data as efficiently. The computing price also has fixed pricing based on the cluster size and type, so it’s quite simple to estimate the final pricing compared to other solutions. The other main price components are hot cache (SSD) and cloud storage. The tables can be configured one by one for the retention and cache. This makes efficient cost management possible. Optimizing tables in Kusto for aggregate calculations can significantly enhance performance and reduce costs, especially when frequent short-term aggregates aren't required. This approach streamlines cache management and aligns data strategy with actual usage patterns, ensuring efficient resource utilization in Azure environments. More about caching and retention can be found in the documentation.
Learnings about data aggregates
One of the key concepts of ADX is materialized views; with them, it’s possible to create aggregates in real-time cost-effectively. There are a few caveats. First, it’s not possible to use the summarize command more than once, and second, it’s not possible to change the way to calculate without calculating the whole data again with backfill. Basically, if you know there will be minor changes with a lot of data, this can cost a lot. Also, you will have service down as you need to drop and recreate it; it's not desirable in production. This is why I used functions as much as I could. We are doing a proof of concept in the project, and many things change fast. Also, making changes in Power BI tends to be time-consuming, so I try to have a kind of adapter pattern inside the functions to minimize changes on the Power BI’s side. Another issue is that I cannot calculate all the aggregates immediately if they rely on other data. For this reason, I used Azure Data Factory to orchestrate calculations directly to the table like this:
Then I am basically free of all limitations. I can delay the calculations at will and summarize as I want. I can also change the way I calculate if I need to.
Updating data in ADX
"Since Azure Data Explorer (ADX) is an append-only data warehouse product, it inherently allows duplicates. To address this, we can use a 'group by' with the key, coupled with the ingestion_time() internal function, like this:
ADX lacks an internal ID, and relying on row numbers for filtering is often problematic due to non-deterministic return order, which isn't reliable for precise data retrieval. However, if there's a datetime column available, it can be a suitable alternative to the internal function.
In practice, handling duplicates is crucial, as illustrated by my experience with unwanted duplicates from an API source. These duplicates led to interesting issues when using anti-join. For instance, in my case, the anti-join failed to match any records because of duplicates on the other side. So, if you encounter unexpected behavior with anti-join, it's advisable to check for duplicates.
Power BI with ADX
Power BI has two primary methods for retrieving data from Azure Data Explorer (ADX): import and DirectQuery. Importing data into Power BI's internal memory allows for the full use of all Power BI's features. On the other hand, DirectQuery doesn't import data; instead, the data is fetched from the source in real-time whenever a visualization is rendered or data is manipulated. This method is suitable for very large datasets that don't fit well into Power BI's memory due to size constraints. ADX query size by default is also limited to 500 000, so bigger than we need to create DirectQuery and use filtering strategy. However, DirectQuery comes with a trade-off: it limits the features available in Power BI, as the data isn't stored in memory, and calculations need to be performed on the data source side. One of the most critical ones is that we cannot use default time filters anymore. One trick is to import unique values in a column and then, in the data model, link it to the larger dataset. Using a composite model, we can leverage most of the features from Power BI. Here is a good example of M Queries
When setting up data in ADX for Power BI, you can choose between using tables, materialized views, or functions. Functions are particularly useful because they allow you to abstract and encapsulate the data, making it possible to modify the underlying data without impacting the Power BI reports that depend on it.
For small to moderately-sized datasets, I recommend using the import method to leverage Power BI's full range of features. Only use DirectQuery when dealing with datasets that are too large to import. While you might initially think that the limited features of DirectQuery are sufficient, you'll often find that even simple style changes, such as customizing the color palette for labels, require capabilities that are only available with imported data. You can find the full list of limitations in Power BI docs.
ADX internal dashboard
I found the internal dashboard very easy to use. Also, it has very nice features for time series data as it automatically gives nice options for drop-down and the option to drill down with drag. This makes it a great tool to debug issues in the system where the data is from. Finding a time series with the biggest drop (blackouts) or zero standard deviation (broken) is also easy. Documentation is also easy to follow, and in less than a day, I already had quite a nice dashboard. Here is a demonstration of how we can find devices with the biggest drops in a few simple lines:
One clear issue with the dashboard is that sharing it can be quite difficult. Yes, you can use Active Directory (AD) groups, but you must remember to give access to all tables (or databases) needed. You cannot share just the dashboard, if you do not want to share the underlying data. In most cases, it’s good for internal use but not external use. Also, because the use of AD is quite complex, the process is prone to errors.
ADX version control
Like most database tools, there is no proper version control solution for ADX. I would recommend using infrastructure as a code approach to have all your functions, table definitions, etc., in the repository. I also created a daily checkpoint to use the .show functions command and save it to a file with the data factory. This way, I had daily checkpoints if I forgot to update the IAC pipeline. I also created a small Python script that automatically converts the .show function files to IAC format. I did not have to remember anymore which functions I had touched and which did not. This was particularly useful because the IAC pipeline ran quite slowly, so checking changes with the pipeline was not the easiest option.
Conclusion
In conclusion, Azure Data Explorer (ADX) is a robust and versatile asset for any data engineer's toolkit. Its adaptability and efficiency in handling real-time data analytics, especially in complex IoT environments, are truly impressive. Through this blog, I've shared the hands-on experience and insights I gained over four months, covering the nuances of ADX's capabilities and how it seamlessly integrates with tools like Power BI.
Whether you're tackling streaming data challenges, optimizing for cost and performance, or navigating the intricacies of Kusto Query Language, ADX offers a solution that can be tailored to a wide range of data engineering needs.
Brightly is here to assist those looking to harness the full potential of ADX or seeking guidance on their data journey. Our expertise in ADX can help you unlock new levels of efficiency and insight in your data projects. Feel free to reach out to us, and we'll be more than happy to explore how we can help you elevate your data solutions to new heights!